We’re getting near the end of the year, and I thought I would pull up the closed sales on area lakes comparing 2023 to 2022, year to date (January through December 5th). I included island properties in my comparisons. The results were pretty amazing. Of the ten lakes I compared, seven of them had major sales price increases over the previous year. However, the number of sales dropped or stayed the same on seven of the lakes because of the shortage of listings, and six of the lakes saw days on the market increase. Here are the self-explanatory statistics:
Lake Winnipesaukee
2023: 85 listings closed with an average selling price of $2,951,327 and a median selling price of $2,150,000 (19.6% increase over 2022). Prices ranged from $410,000-$14,000,000. Listings were on the market for an average of 45 days and a median of 12 days.
2022: 98 listings closed with an average selling price of $2,372,479 and a median selling price of $1,797,500. Prices ranged from $400,000-$12,300,000. Listings were on the market for an average of 30 days and a median of 10 days.
Lake Winnisquam
2023: 12 listings closed with an average selling price of $1,643,082 and a median selling price of $1,512,500 (11% increase over 2022). Prices ranged from $698,000-$3,499,990. Listings were on the market for an average of 38 days and a median of 24 days.
2022: 18 listings closed with an average selling price of $1,563,972 and a median selling price of $1,362,500. Prices ranged from $650,000-$3,500,000. Listings were on the market for an average of 7 days and a median of 6 days.
Lake Waukewan
2023: 5 listings closed with an average selling price of $1,079,800 and a median selling price of $1,349,000 (53.3% increase over 2022). Prices ranged from $425,000-$1,500,000. Listings were on the market for an average of 59 days and a median of 3 days.
2022: 5 listings closed with an average selling price of $1,060,000 and a median selling price of $880,000. Prices ranged from $650,000-$1,610,000. Listings were on the market for an average of 99 days and a median of 91 days.
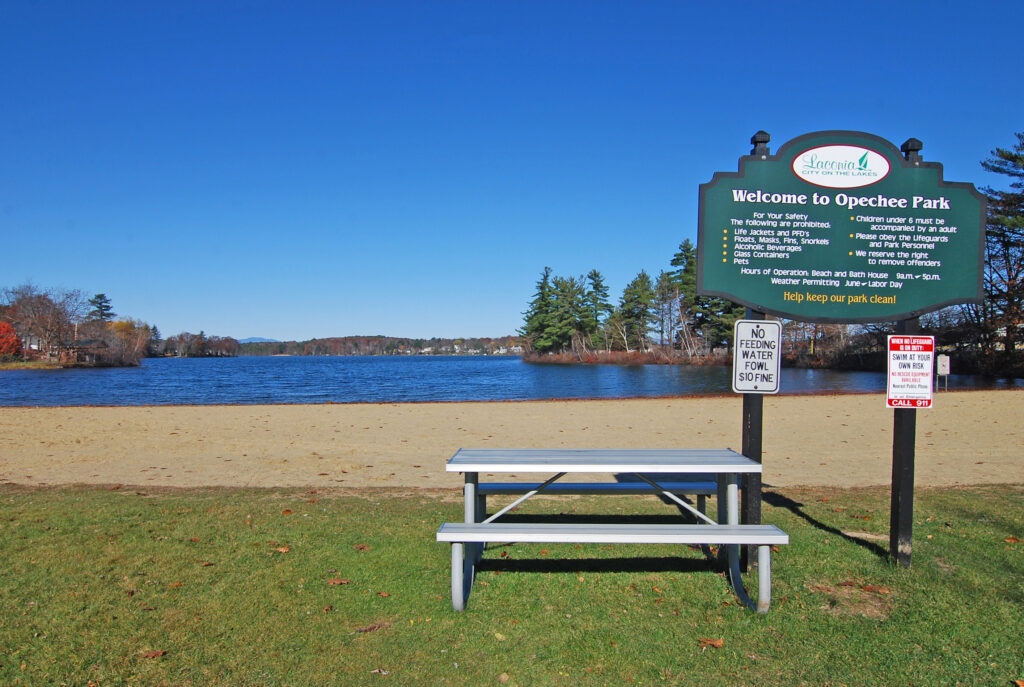
Lake Opechee
2023: 1 listing closed with a sales price of $775,000 and was on the market for 27 days.
2022: 3 listings closed with an average selling price of $1,491,666 and a median selling price of $1,425,000. Prices ranged from $1,400,000-$1,650,000. Listings were on the market for an average of 13 days and a median of 8 days.
Lake Wentworth
2023: 4 listings closed with an average selling price of $1,557,250 and a median selling price of $1,639,500 (0.64% decrease over 2022). Prices ranged from $1,150,000-$1,800,000. Listings were on the market for an average of 6 days and a median of 8 days.
2022: 3 listings closed with an average selling price of $2,017,000 and a median selling price of $1,650,000. Prices ranged from $901,000-$3,500,000. Listings were on the market for an average of 12 days and a median of 14 days.
Merrymeeting Lake
2023: 4 listings closed with an average selling price of $1,272,475 and a median selling price of $1,177,450 (1.87% decrease over 2022). Prices ranged from $435,000-$2,300,000. Listings were on the market for an average of 83 days and a median of 8 days.
2022: 8 listings closed with an average selling price of $1,184,000 and a median selling price of $1,200,000. Prices ranged from $950,000-$1,495,000. Listings were on the market for an average of 24 days and a median of 12 days.
Lake Kanasatka
2023: 3 listings closed with an average selling price of $842,166 and a median selling price of $911,500 (27% increase over 2022). Prices ranged from $700,000-$915,000. Listings were on the market for an average of 9 days and a median of 8 days.
2022: 5 listings closed with an average selling price of $845,800 and a median selling price of $715,000. Prices ranged from $650,000-$1,295,000. Listings were on the market for an average of 12 days and a median of 6 days.
Ossipee Lake
2023: 12 listings closed with an average selling price of $1,553,333 and a median selling price of $1,514,000 (10.1% increase over 2022). Prices ranged from $740,000-$2,345,000. Listings were on the market for an average of 48 days and a median of 37 days.
2022: 8 listings closed with an average selling price of $1,377,750 and a median selling price of $1,375,000. Prices ranged from $307,000-$2,515,000. Listings were on the market for an average of 9 days and a median of 7 days.
Newfound Lake
2023: 11 listings closed with an average selling price of $2,631,730 and a median selling price of $1,825,000 (40.4% increase over 2022). Prices ranged from $1,000,000-$8,820,000. Listings were on the market for an average of 37 days and a median of 11 days.
2022: 6 listings closed with an average selling price of $1,203,500 and a median selling price of $1,300,000. Prices ranged from $796,000-$1,425,000. Listings were on the market for an average of 37 days and a median of 22 days.
Squam Lake
2023: 6 listings closed with an average selling price of $6,108,833 and a median selling price of $6,000,000 (87.5% increase over 2022). Prices ranged from $4,358,000-$7,900,000. Listings were on the market for an average of 21 days and a median of 4 days.
2022: 6 listings closed with an average selling price of $4,077,504 and a median selling price of $3,200,000. Prices ranged from $1,575,000-$8,000,000. Listings were on the market for an average of 24 days and a median of 13 days.
You can see from the above our area lakes showed considerable appreciation. Can you believe Squam Lake experienced an 87.5% increase in the median sales price over the previous year? Lake Waukewan had a 53.3% increase. Newfound Lake had a 40.4% increase, and Lake Winnipesaukee had a 19.6% increase. These historic numbers are certainly raising eyebrows. It will be really interesting to see how 2024 unfolds on the waterfront.

This article was written by Frank Roche. Frank is president of Roche Realty Group with offices in Meredith and Laconia, NH, and can be reached at (603) 279-7046. Data was compiled by a NEREN search on 12/5/2023 and is subject to change. Please feel free to visit www.rocherealty.com to learn more about the Lakes Region and its real estate market.
